


 10 / 20

CCPD ANNUAL REPORT
2015–2016
9
%
20
%
TOTAL UPIC
EXPERIENCES
8
%
STUDENT PARTICIPATION IN THE UPIC PROGRAM — FIVE-YEAR TREND
OTHER UPIC NUMBERS
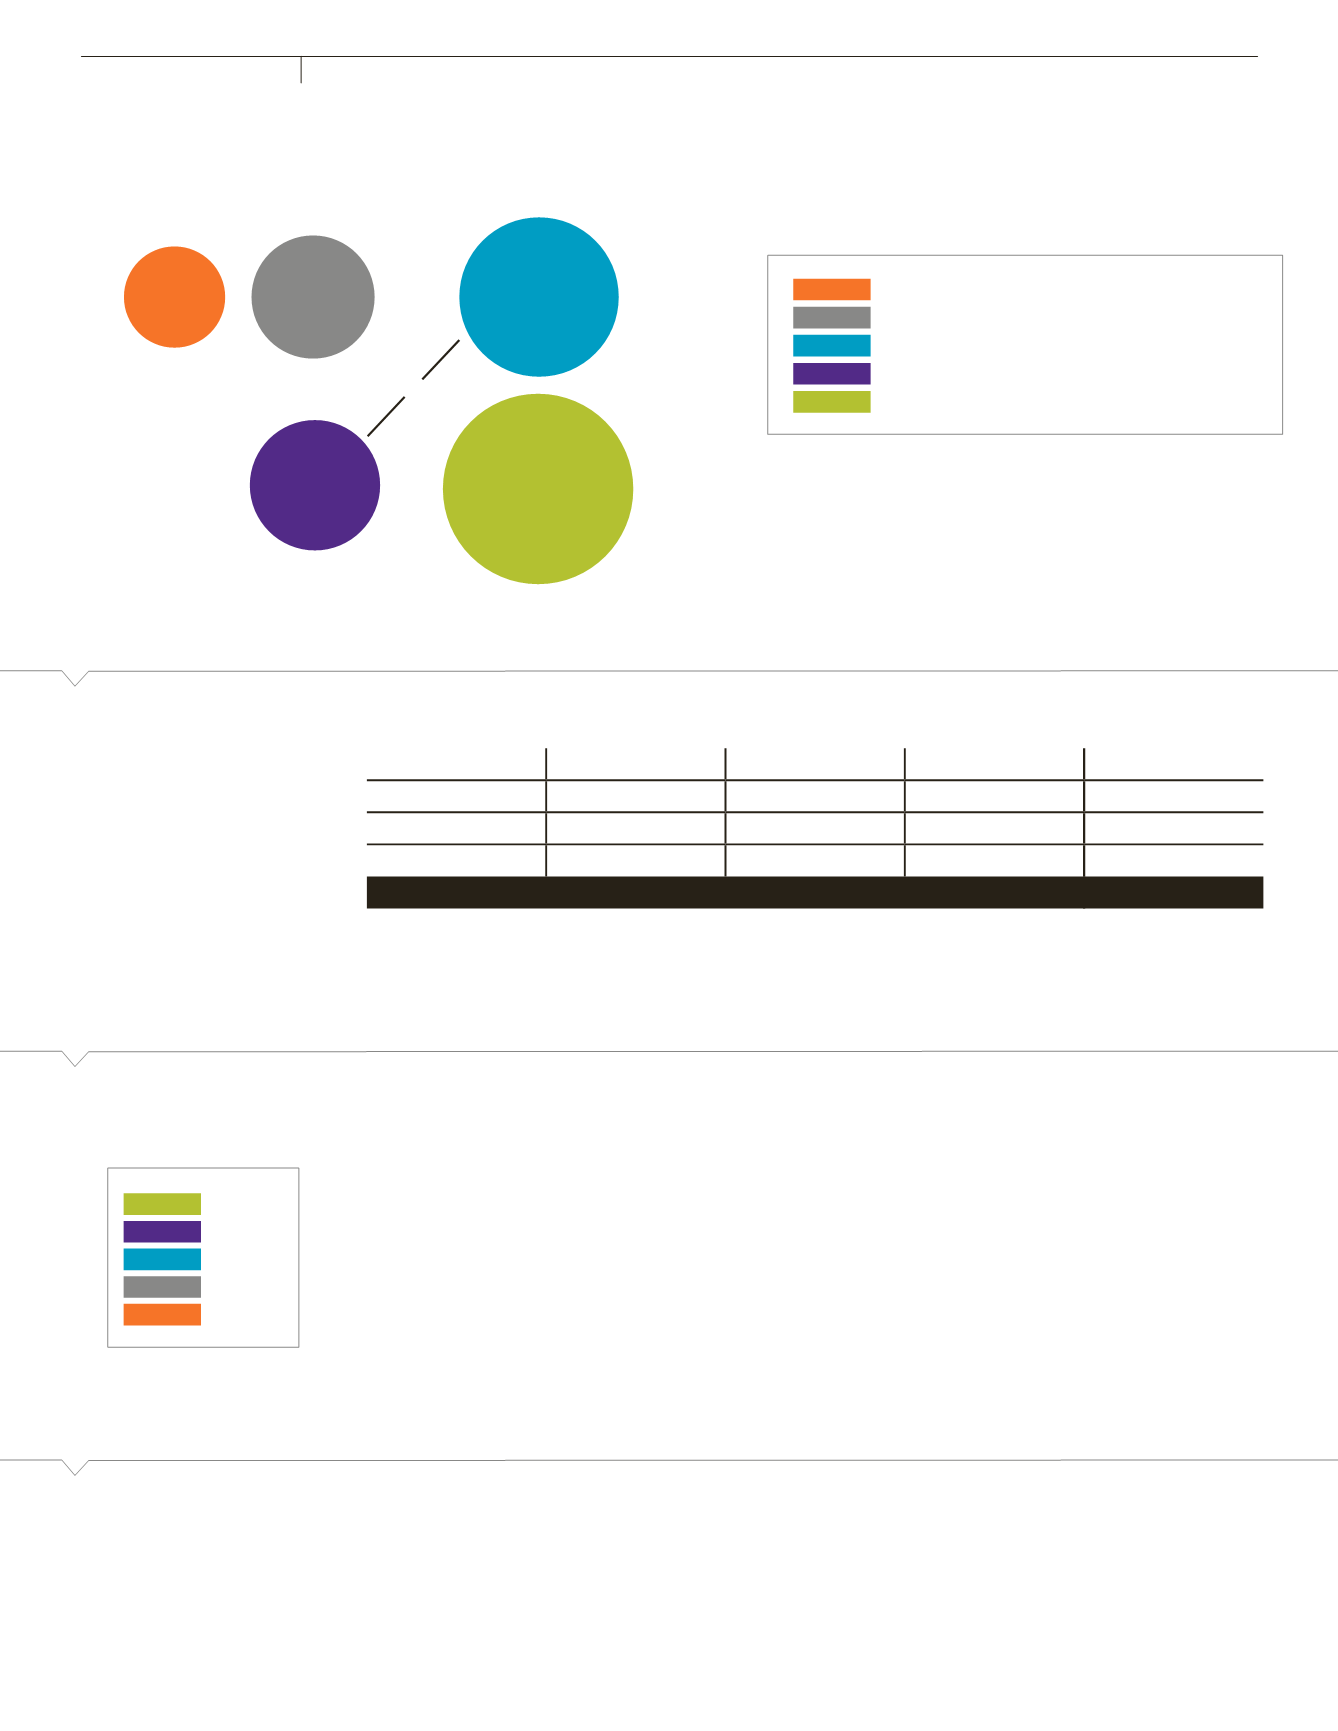
College Breakdown
UPIC AND OFF-CAMPUS STUDENT INTERN ATTRIBUTES
On a five-point scale, organizations rated the degree to which Clemson internships exhibited:
• Creative Thinking Skills — 4.50/5.00
• Critical Thinking Skills — 4.47/5.00
• Communication Skills — 4.45/5.00
STUDENT ENROLLMENT IN EXPERIENTIAL EDUCATION
EXPERIENTIAL EDUCATION
INT Course Enrollment
Cooperative Education Course Enrollment
Total CCPD Experiential Education Courses
Other Campus Experiential Education Courses
Total University Experiential Education Courses
increase in campus experiential
education enrollment since 2014–15
of students are more likely to have accepted
a position at the time of graduation when having
participated in an experiential education
opportunity (First Destination Survey).
2011–12
2012–13
2013–14
2014–15
2015–16
Fall
74
Fall
87
Fall
303
Fall
290
Spring
20
Spring
78
Spring
206
Spring
349
Spring
342
Summer
33
Summer
71
Summer
196
Summer
197
Summer
224
Total
53
Total
223
Total
489
Total
849
Total
856
increase in student enrollment
from 2014–15 to 2015–16
24
%
9
%
27
%
34
%
6
%
100
%
of UPIC interns could explain the significance of their internship experience in relation
to career goals
(by identifying a list of specific companies or professions they were interested in pursuing.)
751
site visits were conducted by UPIC staff.
96
%
of UPIC interns rated the overall quality of their internship as “Good” or
“Excellent,” in relation to connecting and applying their classroom knowledge with
real-world experience.
CHEHD
CES
CBBS
CAAH
CAFLS
916
1,418
2,334
=
=
3,969
1,635
+
+