


 14 / 20

CCPD ANNUAL REPORT
2015–2016
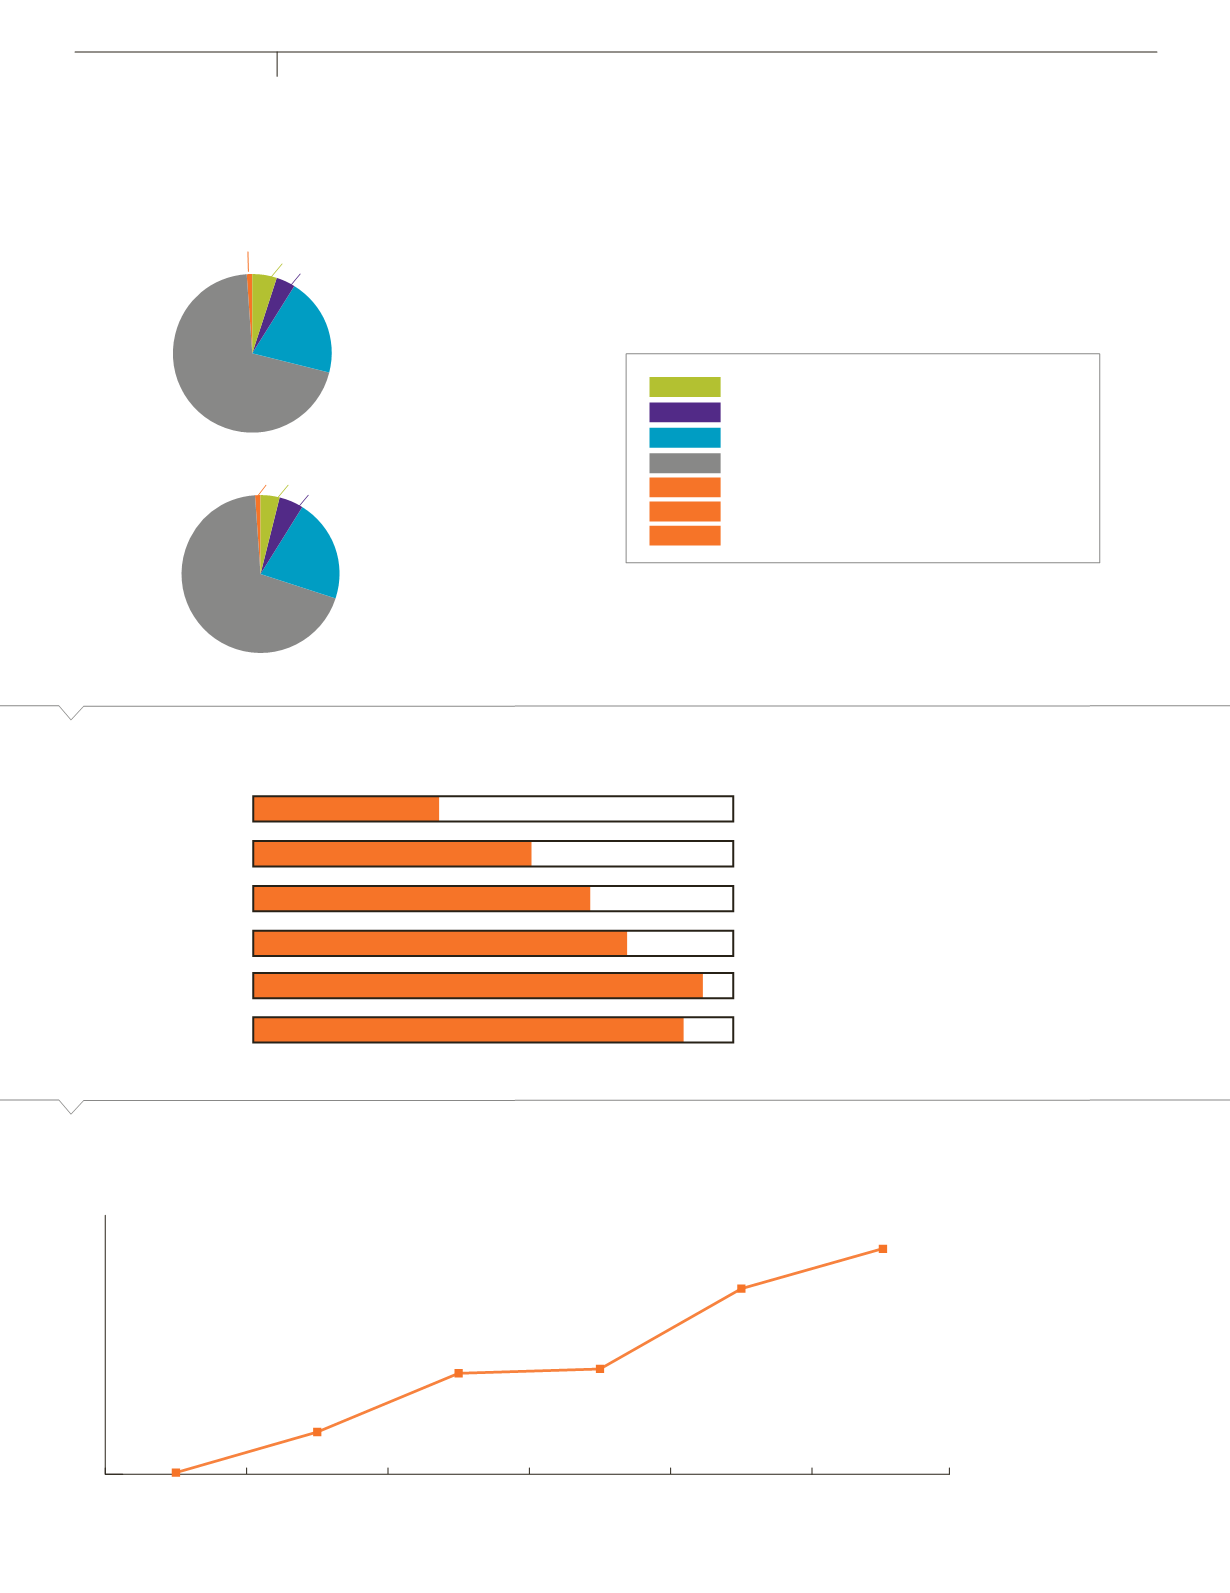
CAREER FAIR ATTENDANCE BY COLLEGE
The following charts show total student attendance of Clemson’s Fall and Spring Career Fairs:
CAREER FAIR EMPLOYER PARTICIPATION — SIX-YEAR TREND
2
,
026
total
2
,
864
total
CAREER EVENTS
SPRING 2016
FALL 2015
TOTAL STUDENT ATTENDANCE — SIX-YEAR TREND
2
,
660
3
,
415
3
,
968
4
,
297
5
,
362
4
,
918
2011–12
2010–11
2012–13
2013–14
2014–15
2015–16
302
349
422
515
417
69
%
20
%
5
%
3
%
5
%
3
%
66
%
26
%
2010–11
2011–12
2012–13
2013–14
2014–15 2015–16
54
%
six-year increase
CES
CBBS
CAAH
CAFLS
Agriculture, Forestry and Life Sciences
Arts, Architecture and Humanities
Business and Behavioral Sciences
Engineering and Science
Health, Education and Human Development
Eugene T. Moore School of Education
Interdisciplinary Studies
CHEHD
<
1
%
<
1
%
537
EDUC
IS